Icomera has released the latest Passenger Wi-Fi usage levels from 30,000+ trains, trams, buses, and coaches across Europe and North America, tracking public transport’s rate of recovery as COVID-19 restrictions are eased.
Recapping on the last update, all regions saw a dramatic drop-off in weekly Passenger Wi-Fi usage through March – tracked as a percentage of usage levels in the corresponding weeks in 2019 – reaching their respective low points between late March and late April. While all regions have clearly felt the impact, the session volume data illustrates that some fell further than others, and the subsequent recovery rates do vary.

(View full resolution here)
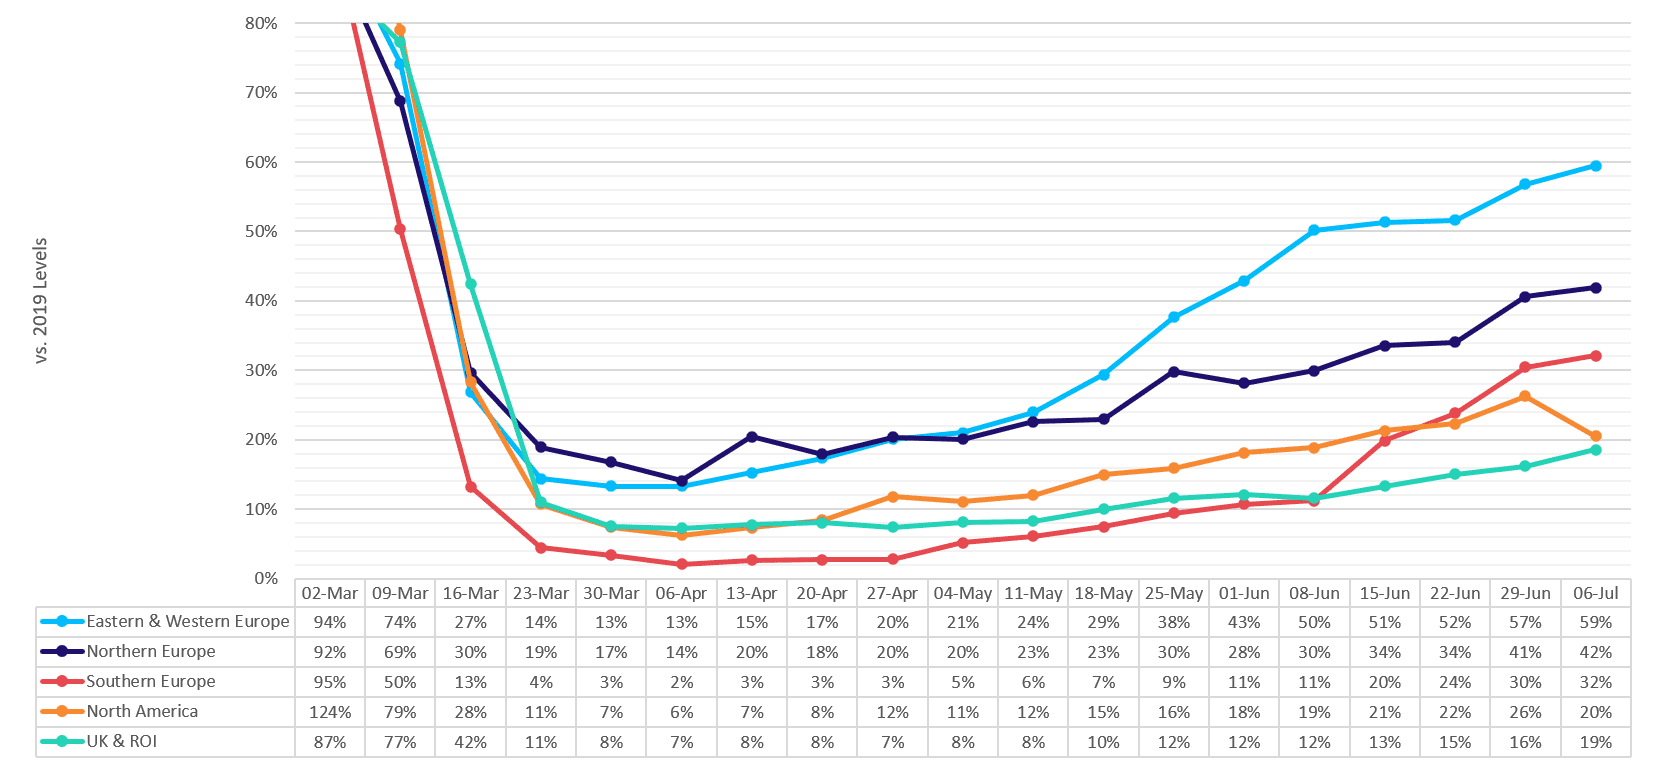
- Eastern and Western Europe* are showing the strongest recovery. Passenger Wi-Fi usage in these regions has currently made a +46 percentage point recovery from the lowest point (13%), to now sit at 59% of 2019 levels.
- Northern Europe (excluding the UK and Republic of Ireland) is up 28p.p. to 42%, demonstrating a gradual recovery from a comparatively less impacted position.
- Southern Europe is emerging from the after-effects of the toughest lockdowns and currently showing the second fastest recovery rate, up 30p.p to 32%, following the widespread lifting of restrictions across the region in early – mid June.
- North America is up 14p.p. from its low point to 20% but has experienced a -6p.p. setback in the last week. Notably, Passenger Wi-Fi usage in the region has not bounced back from its annual Independence Day dip as quickly as it has in previous years.
- In the United Kingdom and the Republic of Ireland, government advice up to now has been to avoid public transport unless absolutely necessary. These regions are still experiencing the slowest returns, up 12p.p. to 19% of 2019 levels. However, the 2p.p. recovery seen in the past week, following a significant easing of restrictions in the UK on July 4th, is the largest weekly improvement these regions have seen to-date.
A Shift in Passenger Travel Habits?
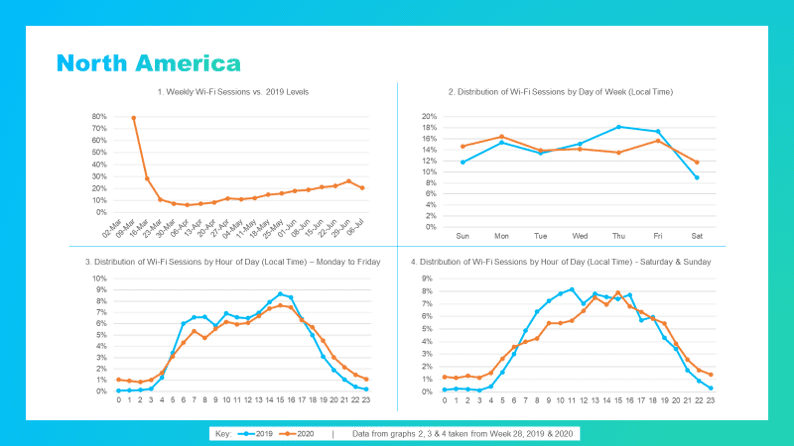
Icomera is now also reporting on the distribution of Wi-Fi sessions by day of the week, and by time of day. The latest data is taken from Week 28 in 2020 and compared with the same week in July 2019.
All data is presented in local time. For example, Passenger Wi-Fi sessions that took place at 9am EDT on the east coast of North America (1pm UTC) are shown on the graph at 9am. Sessions that took place at 9am PDT on the west coast of North America (4pm UTC) are also shown on the same graph at 9am.

Wi-Fi Session distribution graphs for all regions included in the data are available to view here
- Generally, regions with the strongest recoveries are seeing less of a shift in travel habits. Northern, Eastern and Western Europe show only minor variances between daily and hourly Wi-Fi session distribution in 2019 and 2020.
- We see the most obvious shift in the distribution of Wi-Fi sessions by the day of the week in North America, with a greater percentage now taking place outside of the pre-COVID peak days.
- Looking at the distribution of Wi-Fi sessions by hour of day for Monday to Friday in all regions, the obvious pre-COVID morning and late-afternoon peak hours have been replaced with quieter mornings and a more gradual ramp-up to mid – late afternoon peaks; this is particularly noticeable in North America, Southern Europe, the UK and the Republic of Ireland.
We caution that in some cases, the data will reflect the service scheduling adjustments already made by public transport authorities and operators, while in other cases it will be due to travel choices made by the passenger themselves. Still, the data is a valid measure of when passengers are travelling, regardless of causality, and can be used to inform further service schedule adjustments where Wi-Fi session usage and public transport service capacity do not tally.
This further highlights the value of fast access to operational data from onboard systems in the industry’s mission to protect passengers, control the spread of the virus, and shift society’s travel habits back towards sustainable, green mobility.
*Since the last update, Eastern and Western Europe’s recovery rates have converged, so we have combined them to streamline the report.


